| Delphi Clinic | C++Builder Gate | Training & Consultancy | Delphi Notes Weblog | Dr.Bob's Webshop |
| Delphi Clinic | C++Builder Gate | Training & Consultancy | Delphi Notes Weblog | Dr.Bob's Webshop |
|
This article is part of a two-part Delphi/C++ collaboration. This C++ part describes deployment of a little debugging tool in the Borland C++ IDE, while the Delphi part describes the design and implementation of this tool. I suggest you read both parts for the whole story.
Runtime Error?
If you write programs, you sometimes make mistakes.
At least I do.
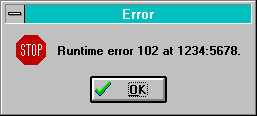
Some of these mistakes result in a runtime error of the program, which looks a bit like this (while the actual appearance may differ, the contents will essentially be the same):

Which?
The system modal message you get shows you two important kinds of information.
First of all, the number of the run-time error.
Often, this will be 216, which is the same as a General Protection Fault.
A GPF is most often caused by writing to something that doesn't belong to you (like a memory or variable overwrite).
The runtime error above can be found in the manual or on-line help to be a stack error.
Where?
More important, however, is the place where this runtime error occurred.
The message gives us that information, too.
The error address ($1234:$5678 in the example above) can be used to get to the exact source file and line number where the error occurred.
Note that this will often be the place where the error was triggered, but not necessarily the cause of the error.
A memory overrun may be caused by an earlier memory allocation that was too short (or forgotten at all), for example.
The place to start looking for this address is the MAP file that belongs to the application.
In order to create a detailed MAP file for a Borland C++ application, you must also have selected the "Detailed Map File" linker option, as well as the "Include Line Numbers" in the debugging page of your project options.
How?
Let's assume that we've created a detailed MAP file for our application.
This MAP file will contain, among other things, a list of error addresses and source line numbers, grouped together for each source file that is part of the application.
A few example lines from a MAP file can be seen below:
   Line numbers for Findmap(FINDMAP.DPR) segment Findmap

      9 0001:001F    10 0001:005B    11 0001:006B    12 0001:0083
     13 0001:008E
Now just say that a runtime error has occurred at $0001:$0083, then we can see from the fragment above that the corresponding source file is FINDMAP.DPR at line number 12.
Debugging?
If you debug an application from within the IDE (using the integrated debugger), then you will end up at the appropriate source file and line number whenever a run-time error occurs, but most of the time an error occurs when we're not debugging.
Or a client calls us to tell that an error just occurred (and you may only hope we wrote down that address).
Since we all know that reproducing an error is just as hard as fixing it, we should be glad to have a feature that enables us to find an error by it's address!
FindMap!
The first part of this article deals with a little tool written in Delphi to do the searching in the map file for us.
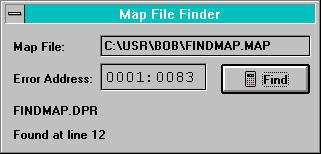
As an example, let's open up the FINDMAP.MAP file and look for a runtime error that supposed to have happened at address 0001:0083.
The answer is given immediately at line 12 of file FINDMAP.DPR.
Granted, we have to locate and open the file by ourselves, but at least now we know where to look.

Integration
In order to integrate our FINDMAP add-on tool in the Borland C++ IDE, so we can start it from within the IDE whenever we want, we have to add it as a tool to the IDE itself.
For that, we need to open up the Options | Tools dialog from the Borland C++ 4.5x IDE.
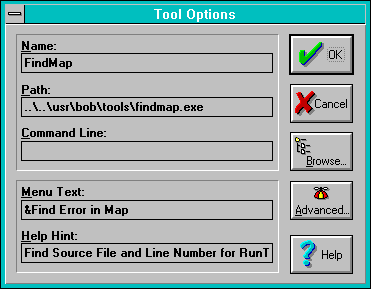
Here, we click on the "New" button to get the following dialog where we have to define the settings for our FINDMAP debugging tool:

The Name of this tool is FindMap, and you can use the Browse button to find the executable (in this case it's in ..\..\usr\bob\tools\findmap.exe).
FindMap does not use any command line arguments, so we can leave the third entry free.
If you want FindMap to use any command-line arguments, you can specify them here, but you'll have to modify the original Delphi source code to make FindMap recognise and use these parameters (see WinTech Journal for the Delphi source code of FindMap).
The Menu Text is "Find Error in Map", and I've included a rather long Help Hint that comes in the statusbar (see figure 4 for an example).
IDE - Integrated Development Environment
The result is my personal Borland C++ IDE - the original IDE with my add-on tool, a true integrated development environment:

As soon as we start the FindMap tool, we're being asked to locate the MAP file. The integration with the IDE and FindMap is not strong enough that FindMap can automatically find the MAP file for the current target. Of course, this can be added (as part of the command-line arguments), but let's leave that for another day.
FindMap in Action
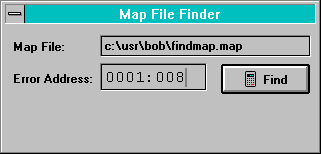
As soon as we've located and opened the correct MAP file, we're inside the FindMap dialog itself, and we can then enter the error address we're looking for.
The dialog automatically selects the error address, so all we need to do now is to type the 8 digits and press on the Find button.

The result will be the same as the earlier session. Note that we could have placed the result in a so-called "messages" window so we can get to the file and line number automatically. This, however, means that we'd have to write a much tighter integration with the Borland C++ IDE; one which requires a special "filter" DLL to be written - a task which again is better left for another story on another day. The accompanying FindMap in Delphi article will show you how to design and implement this little debugging tool in Delphi.